
How the platform works
Our methodology combines physics, behaviour and economics. The platform works for one home and for ten thousand homes. Same logic, same calculations, only the scale differs. This makes it suitable for both the individual situation and neighbourhood- or portfolio-scale modelling.
Physics + behaviour + economics
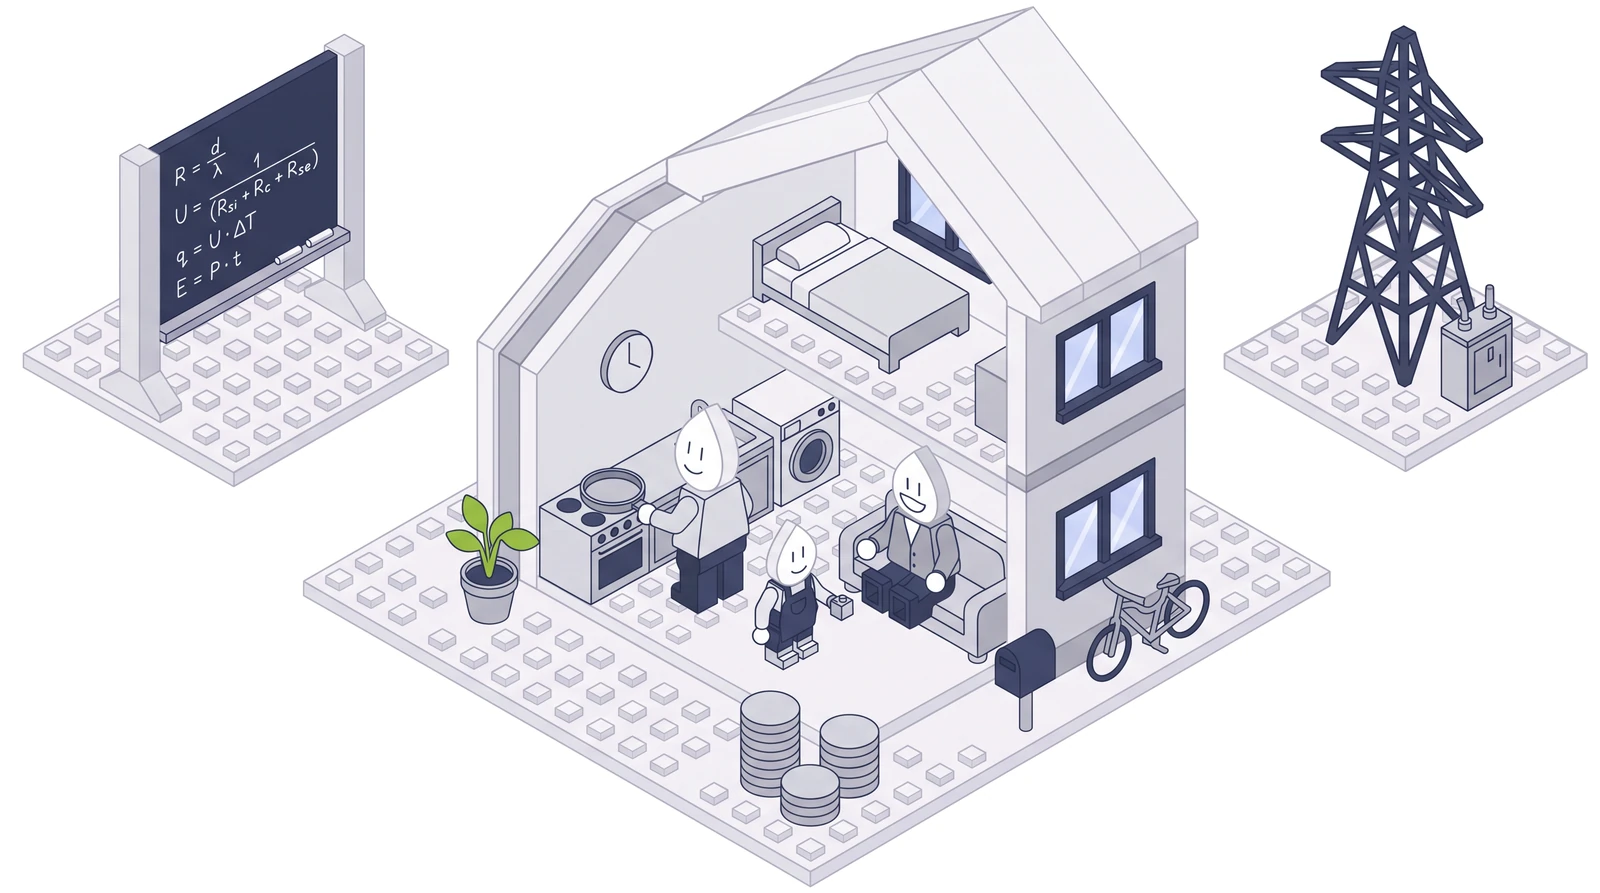
The value of De Duurzame Oplossing sits in the combination of three layers interacting, across all 8,760 hours of the year, for every individual home.
Physics
The building envelope as a thermodynamic system. An extensive library of pre-computed home configurations (geometry, build year, envelope components, location, orientation) that yields a validated heating demand for nearly any Dutch home, across all 8,760 hours of the year.
Behaviour
When and how residents use energy. Shower peak at 07:00, cooking peak at 18:00, charging peak at 23:00. Behaviour profiles linked to time of day, which makes peak load modellable per neighbourhood.
Economics
Price evolution, dynamic tariffs, payback periods, subsidies. Which measure pays off now and which in five years? The economic layer makes scenarios comparable in euros and in time.
Methodology
From validated physics to fast application. We combine a strong computational base with several ways to put that knowledge to work.
Speed on top of the foundation
Building-physics simulations are accurate but slow: a single run can take minutes to hours. For advice where you need immediate insight, or for portfolios with thousands of addresses, that isn't workable.
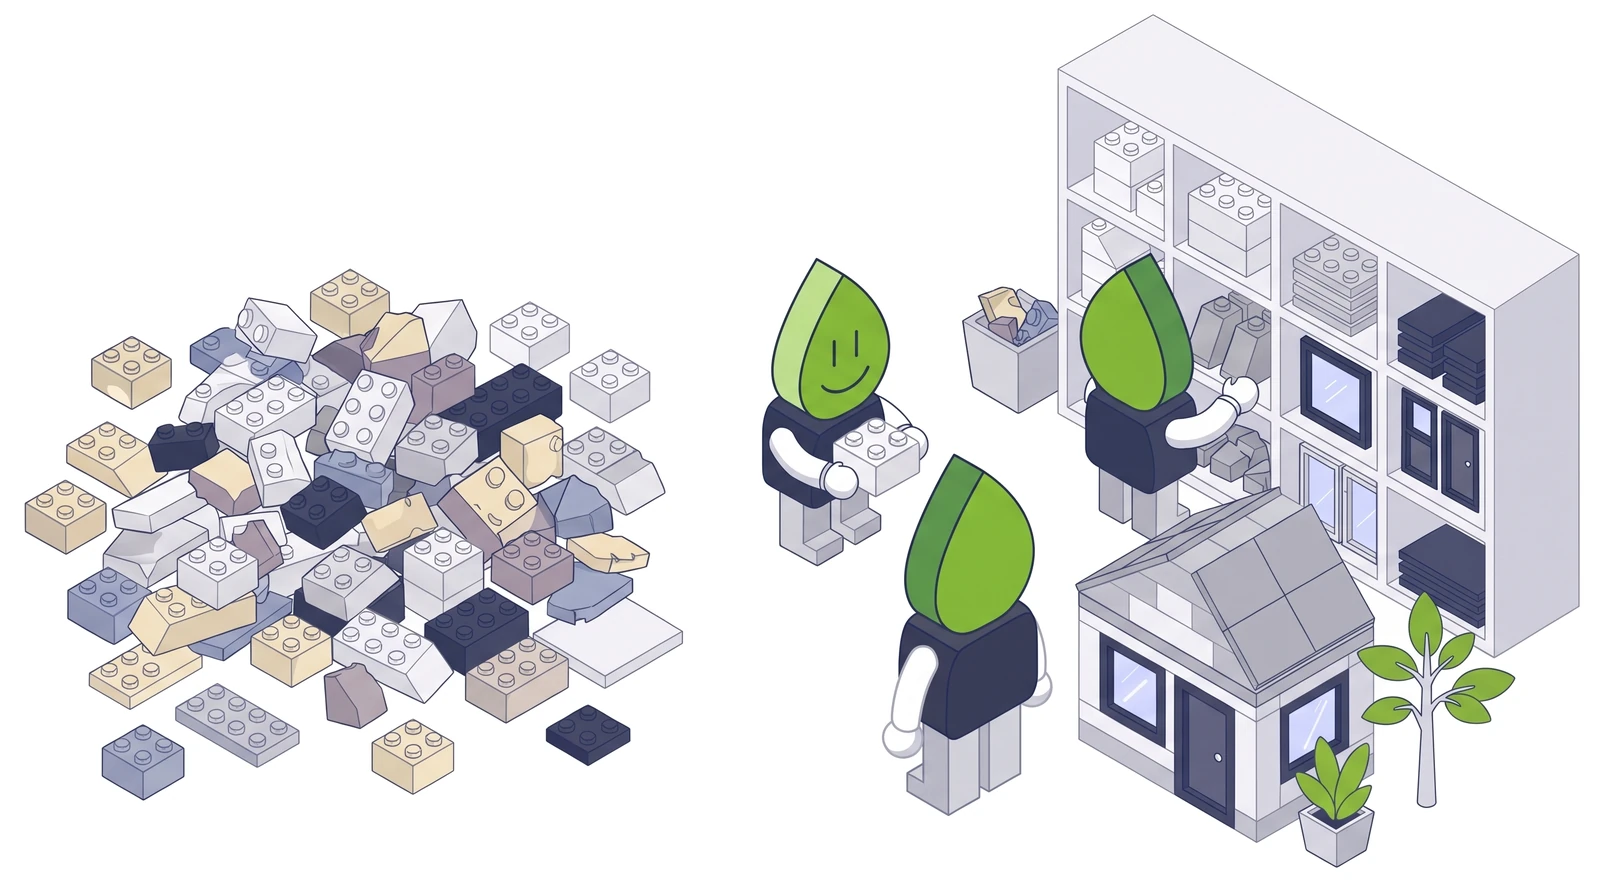
We ran a billion simulations and used them to build a dataset of millions of pre-computed home configurations. We trained a fast surrogate on top of it. The surrogate produces a heating-demand prediction for nearly any Dutch home in a fraction of a second, staying close to what a full simulation would give.
The foundation stays grounded and validated; the speed layer makes it usable at the scale and speed clients ask for.
Both REST API and MCP
The knowledge base is accessible in two ways: for the AI workflows emerging now, and for the classic integration patterns.
For AI assistants and agents
Rather than building a full web interface, we let a language model discover the tools. The user describes in natural language what they want; the model finds the right tool, asks for parameters, and presents the result.
No menu navigation, no complex sitemap. Chat functions as a universal search across all functionality. Fast validation becomes possible: months of frontend work turn into a chat-interface demo.
For systems and dashboards
For connections between systems, batch computation and integration into existing dashboards. Same backend, same calculations, same dataset. Only a different way of getting there.
Both workflows are documented and versioned. Adding a new measure to a tool, a new scenario variant, an additional dataset: these change the knowledge, not the way you reach it.
What do you get back?
- Zooming in to the level of the individual home. Every home in a portfolio gets its own representation. You see what applies per home, while you can also step back to the level of the neighbourhood.
- Deltas across scenarios. For this home, this household, this build year: what does new glazing yield? What's the euro impact of a heat pump? The difference is what people need to decide.
- Deltas across time. How it was, how it is now, how it could be. Evaluation of the past, comparison with now, projection forward.
- Discovering new connections. Because the data is stored in a structured way, you can explore relationships nobody thought of in advance. For example: what do all refrigerators use in south-facing apartments with three residents?
Curious what this means for your situation?
A neighbourhood plan, a portfolio calculation or an integration. Find out which insights move your energy question forward, and what a logical next step looks like.
Schedule a conversation